If you are coding since many years in C or C++ you probably hit many tools that helped in finding memory leaks in your code as well as did bounds checking to avoid buffers overrun. Those were PurifyPlus (rational), BoundsChecker (numega). Then valgrind cameout and all linux developers were happy to run valgrind on their code to find leaks and bounds overruns.
Since gcc 4.8 and llvm 3.1 Sanitize has been introduce in the compiler as a compile option which gives you the ability to check for :
- leak and bounds overrun : -fsanitize=address
- race conditions : -fsanitize=thread
Using sanitizer in your normal Test environment (we use c++ google test framework to test api code) will drastically change the quality of your software products (C, C++ or GO) by allowing you to spot most of the bounds overrun and leaks during the testing phase, both in your code and in the code that you include not written by you.
In my sample makefiles we build all component that we use in test in debug mode (-g3) and with sanitize settable from outside via an environment variable :
SANITIZE = -fsanitize=address

CXXFLAGS = -std=c++11 -pthread -fpermissive -isystem ../../googletest/include -isystem ../../googletest -DDEBUG -g3 $(SANITIZE)
Compiling a library with sanitize is :
$ make -f libfh.mk debugclean debuglinux
rm -rf fh.do fh.mo libfh-debug.a
cc -DDEBUG -g3 -fsanitize=address -O0 -fPIC --std=c99 -Wall -Wextra -Wcomment -pthread -I . -c fh.c -o fh.do
ar crs libfh-debug.a fh.do
Compiling tests :
$ make -f libfh-test.mk testclean testlinux
rm -rf TestMain.o TestThread.o TestFH.o CommandLineParams.o testfh *.gcda *.gcno gtest-all.o ../../*_test_results.xml
g++ -std=c++11 -pthread -fpermissive -isystem ../../googletest/include -isystem ../../googletest -DDEBUG -g3 -fsanitize=address -I.. -I ../../libutil/src -c -o TestMain.o TestMain.cpp
g++ -std=c++11 -pthread -fpermissive -isystem ../../googletest/include -isystem ../../googletest -DDEBUG -g3 -fsanitize=address -I.. -I ../../libutil/src -c -o TestThread.o TestThread.cpp
g++ -std=c++11 -pthread -fpermissive -isystem ../../googletest/include -isystem ../../googletest -DDEBUG -g3 -fsanitize=address -I.. -I ../../libutil/src -c -o TestFH.o TestFH.cpp
g++ -std=c++11 -pthread -fpermissive -isystem ../../googletest/include -isystem ../../googletest -DDEBUG -g3 -fsanitize=address -I.. -I ../../libutil/src -c -o CommandLineParams.o CommandLineParams.cpp
g++ -isystem ../../googletest/include -I ../../googletest/ -pthread -c ../../googletest/src/gtest-all.cc
g++ -o testfh -fsanitize=address TestMain.o TestThread.o TestFH.o CommandLineParams.o gtest-all.o -L ../ -lfh-debug -lpthread
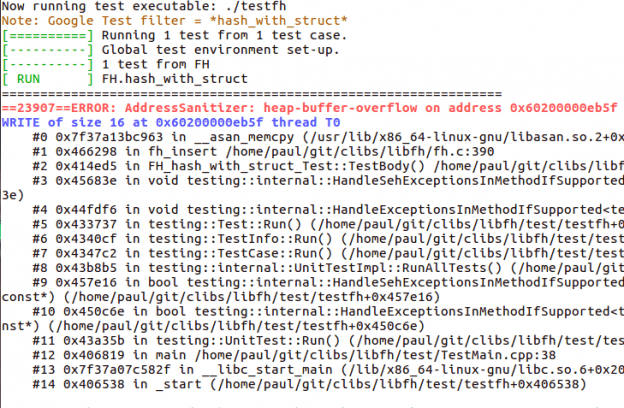
Now let’s run a test (after having introduced a bug) :
paul@paul-bigdesk:~/git/clibs/libfh/test$ ./testfh --gtest_filter=*hash_with_struct*
Running main() in file c-libraries/libfh/test/TestMain.cpp
Now running test executable: ./testfh
Note: Google Test filter = *hash_with_struct*
[==========] Running 1 test from 1 test case.
[----------] Global test environment set-up.
[----------] 1 test from FH
[ RUN ] FH.hash_with_struct
=================================================================
==23907==ERROR: AddressSanitizer: heap-buffer-overflow on address 0x60200000eb5f at pc 0x7f37a13bc964 bp 0x7fff66eca0b0 sp 0x7fff66ec9858
WRITE of size 16 at 0x60200000eb5f thread T0
#0 0x7f37a13bc963 in __asan_memcpy (/usr/lib/x86_64-linux-gnu/libasan.so.2+0x8c963)
#1 0x466298 in fh_insert /home/paul/git/clibs/libfh/fh.c:390
#2 0x414ed5 in FH_hash_with_struct_Test::TestBody() /home/paul/git/clibs/libfh/test/TestFH.cpp:486
#3 0x45683e in void testing::internal::HandleSehExceptionsInMethodIfSupported<testing::Test, void>(testing::Test*, void (testing::Test::*)(), char const*) (/home/paul/git/clibs/libfh/test/testfh+0x45683e)
#4 0x44fdf6 in void testing::internal::HandleExceptionsInMethodIfSupported<testing::Test, void>(testing::Test*, void (testing::Test::*)(), char const*) (/home/paul/git/clibs/libfh/test/testfh+0x44fdf6)
#5 0x433737 in testing::Test::Run() (/home/paul/git/clibs/libfh/test/testfh+0x433737)
#6 0x4340cf in testing::TestInfo::Run() (/home/paul/git/clibs/libfh/test/testfh+0x4340cf)
#7 0x4347c2 in testing::TestCase::Run() (/home/paul/git/clibs/libfh/test/testfh+0x4347c2)
#8 0x43b8b5 in testing::internal::UnitTestImpl::RunAllTests() (/home/paul/git/clibs/libfh/test/testfh+0x43b8b5)
#9 0x457e16 in bool testing::internal::HandleSehExceptionsInMethodIfSupported<testing::internal::UnitTestImpl, bool>(testing::internal::UnitTestImpl*, bool (testing::internal::UnitTestImpl::*)(), char const*) (/home/paul/git/clibs/libfh/test/testfh+0x457e16)
#10 0x450c6e in bool testing::internal::HandleExceptionsInMethodIfSupported<testing::internal::UnitTestImpl, bool>(testing::internal::UnitTestImpl*, bool (testing::internal::UnitTestImpl::*)(), char const*) (/home/paul/git/clibs/libfh/test/testfh+0x450c6e)
#11 0x43a35b in testing::UnitTest::Run() (/home/paul/git/clibs/libfh/test/testfh+0x43a35b)
#12 0x406819 in main /home/paul/git/clibs/libfh/test/TestMain.cpp:38
#13 0x7f37a07c582f in __libc_start_main (/lib/x86_64-linux-gnu/libc.so.6+0x2082f)
#14 0x406538 in _start (/home/paul/git/clibs/libfh/test/testfh+0x406538)

0x60200000eb5f is located 0 bytes to the right of 15-byte region [0x60200000eb50,0x60200000eb5f)
allocated by thread T0 here:
#0 0x7f37a13c8662 in malloc (/usr/lib/x86_64-linux-gnu/libasan.so.2+0x98662)
#1 0x466222 in fh_insert /home/paul/git/clibs/libfh/fh.c:384
#2 0x414ed5 in FH_hash_with_struct_Test::TestBody() /home/paul/git/clibs/libfh/test/TestFH.cpp:486
#3 0x45683e in void testing::internal::HandleSehExceptionsInMethodIfSupported<testing::Test, void>(testing::Test*, void (testing::Test::*)(), char const*) (/home/paul/git/clibs/libfh/test/testfh+0x45683e)
#4 0x44fdf6 in void testing::internal::HandleExceptionsInMethodIfSupported<testing::Test, void>(testing::Test*, void (testing::Test::*)(), char const*) (/home/paul/git/clibs/libfh/test/testfh+0x44fdf6)
#5 0x433737 in testing::Test::Run() (/home/paul/git/clibs/libfh/test/testfh+0x433737)
#6 0x4340cf in testing::TestInfo::Run() (/home/paul/git/clibs/libfh/test/testfh+0x4340cf)
#7 0x4347c2 in testing::TestCase::Run() (/home/paul/git/clibs/libfh/test/testfh+0x4347c2)
#8 0x43b8b5 in testing::internal::UnitTestImpl::RunAllTests() (/home/paul/git/clibs/libfh/test/testfh+0x43b8b5)
#9 0x457e16 in bool testing::internal::HandleSehExceptionsInMethodIfSupported<testing::internal::UnitTestImpl, bool>(testing::internal::UnitTestImpl*, bool (testing::internal::UnitTestImpl::*)(), char const*) (/home/paul/git/clibs/libfh/test/testfh+0x457e16)
#10 0x450c6e in bool testing::internal::HandleExceptionsInMethodIfSupported<testing::internal::UnitTestImpl, bool>(testing::internal::UnitTestImpl*, bool (testing::internal::UnitTestImpl::*)(), char const*) (/home/paul/git/clibs/libfh/test/testfh+0x450c6e)
#11 0x43a35b in testing::UnitTest::Run() (/home/paul/git/clibs/libfh/test/testfh+0x43a35b)
#12 0x406819 in main /home/paul/git/clibs/libfh/test/TestMain.cpp:38
#13 0x7f37a07c582f in __libc_start_main (/lib/x86_64-linux-gnu/libc.so.6+0x2082f)

SUMMARY: AddressSanitizer: heap-buffer-overflow ??:0 __asan_memcpy
Shadow bytes around the buggy address:
0x0c047fff9d10: fa fa fa fa fa fa fa fa fa fa fa fa fa fa fa fa
0x0c047fff9d20: fa fa fa fa fa fa fa fa fa fa fa fa fa fa fa fa
0x0c047fff9d30: fa fa fa fa fa fa fa fa fa fa fa fa fa fa fa fa
0x0c047fff9d40: fa fa fa fa fa fa fa fa fa fa fa fa fa fa fa fa
0x0c047fff9d50: fa fa fa fa fa fa fa fa fa fa fa fa fa fa fa fa
=>0x0c047fff9d60: fa fa fa fa fa fa fa fa fa fa 00[07]fa fa 05 fa
0x0c047fff9d70: fa fa 00 00 fa fa 00 00 fa fa 00 fa fa fa 00 fa
0x0c047fff9d80: fa fa 00 fa fa fa 00 fa fa fa 00 fa fa fa 00 fa
0x0c047fff9d90: fa fa 00 fa fa fa 00 fa fa fa 00 fa fa fa 00 fa
0x0c047fff9da0: fa fa 00 fa fa fa 00 fa fa fa 00 fa fa fa 00 fa
0x0c047fff9db0: fa fa 00 fa fa fa 00 fa fa fa 00 fa fa fa 00 fa
Shadow byte legend (one shadow byte represents 8 application bytes):
Addressable: 00
Partially addressable: 01 02 03 04 05 06 07
Heap left redzone: fa
Heap right redzone: fb
Freed heap region: fd
Stack left redzone: f1
Stack mid redzone: f2
Stack right redzone: f3
Stack partial redzone: f4
Stack after return: f5
Stack use after scope: f8
Global redzone: f9
Global init order: f6
Poisoned by user: f7
Container overflow: fc
Array cookie: ac
Intra object redzone: bb
ASan internal: fe
==23907==ABORTING
You easily get to were the bug is fh.c line 390; we decremented the allocated size by 1:
new_opaque_obj = malloc(fh->h_datalen-1);
Easily you can switch to race conditions checking my using
$ make SANITIZE=-fsanitize=thread -f libfh-test.mk testclean testlinux


 Linux is used on
