Category Archives: coding

Allocating memory inside a Varnish vmod


Writing varnish modules is pretty well documented by the standard varnish documentation, tutorials  and thanks to valuable work from other people here  . There are some areas I felt the need to be further clarified and this post tries to do that.

Allocating memory inside a vmod is tricky if you need to free it when the current Request is destroyed. Here are some ways :

  • per request memory allocation i.e. scope is the request lifetime so memory will be freed when the request is destroyed) :
void WS_Init(struct ws *ws, const char *id, void *space, unsigned len);
unsigned WS_Reserve(struct ws *ws, unsigned bytes);
void WS_MarkOverflow(struct ws *ws);
void WS_Release(struct ws *ws, unsigned bytes);
void WS_ReleaseP(struct ws *ws, char *ptr);
void WS_Assert(const struct ws *ws);
void WS_Reset(struct ws *ws, char *p);
char *WS_Alloc(struct ws *ws, unsigned bytes);
void *WS_Copy(struct ws *ws, const void *str, int len);
char *WS_Snapshot(struct ws *ws);
int WS_Overflowed(const struct ws *ws);
void *WS_Printf(struct ws *ws, const char *fmt, ...) __printflike(2, 3);

This is a per worker thread memory space allocation, no free necessary as data is removed when the request is detroyed. Ex :

VCL_STRING
vmod_hello(const struct vrt_ctx *ctx, VCL_STRING name)
{
   char *p;
   unsigned u, v;

   u = WS_Reserve(ctx->ws, 0); /* Reserve some work space */
   p = ctx->ws->f;         /* Front of workspace area */
   v = snprintf(p, u, "Hello, %s", name);
   v++;
   if (v > u) {
      /* No space, reset and leave */
      WS_Release(ctx->ws, 0);
      return (NULL);
   }
   /* Update work space with what we've used */
   WS_Release(ctx->ws, v);
   return (p);
}

Data is allocated starting with 64k and then when needed in 4k chunks in the cts->ws area. No varnish imposed limit.

  • (since varnish 4.0 up) Private Pointers : a way to have multi-scoped private data per each VCL, TASK. You may access private data either as passed on the VCL function signature or by calling directly VRT_priv_task(ctx, “name”) for example to obtain a per request place to hold :
    • free function
    • pointer to allocated data

This method is very interesting if you need a cleanup function to be called when the varnish request is destroyed.

Webassembly/wasm and asm.js

Photo by Markus Spiske on Unsplash

The web assembly thing. I’ll try to clarify things that I learned working on it:

  1. WASM : short for WebAssembly, a binary instructions format that runs on a stack based virtual machine. Wasm is designed as a portable target for compilation of high-level languages like C/C++/Rust to be run on the Web. Reference here
  2. asm.js : a subset of js, static typed and highly optimizable, created to allow running  higher level languages like C application on the Web. Reference here and here

So you would say 1 and 2 have the same purpose : AFAIK yes. You can also convert asm.js to wasm and decode wasm back to asm.js (theoretically). Seems that WASM is going to be extended in the future compared to asm.js.

Let’s continue :

  1. emscripten  : toolchain to compile high level languages to asm.js and WASM. Uses LLVM and does also come conversion of API (openGL to WebGL for ex) and compiles to LLVM IR (llvm bitcode) and then from LLVM IR Bitcode to asm.js using Fastcomp.
  2. Binaryen (asm2wasm) : compiles asm.js to wasm and is included in emscripten (?)

Supposing that you have a C/C++ project, made of different libraries, I suggest to compile to LLVM IR Bitcode all the single components and just during the link phase generate asm.js/wasm for execution. This will allow you to maintain your building/linking steps as you would have in an standard object code generation environment.
emscripten/LLVM offer a full set of tools to compile.work on IR Bitcode if you like :

  • emmake : use existing makefiles by running emmake make
  • emconfigure : use existing configure command by running emconfigure configure <options>

Also if you want to dig deeper into llvm :

  • lli : directly executes programs in LLVM bitcode format. It takes a program in LLVM bitcode format and executes it using a just-in-time compiler or an interpreter
  • llc : compiles LLVM source inputs into assembly language for a specified architecture. The assembly language output can then be passed through a native assembler and linker to generate a native executable

Once you have all your compiled libraries/components in LLVM IR Bitcode you have to generate WASM. The basic compile command is :

emcc -s WASM=1 -o <prog>.html <prog>.c -l<anylibraryyouneed>

but :

  1. If you are using malloc/free you need to add : -s ALLOW_MEMORY_GROWTH=1
  2. If you are using pthreads in your code/libraries you need to add : -s USE_PTHREADS=1 but as of at Jan 2019 you can’t have both malloc/free and pthreads. More info here.

More to come soon.


golang-console

Profiling a golang REST API server

Profiling :

is a form of dynamic program analysis that measures, for example, the space (memory) or time complexity of a program, the usage of particular instructions, or the frequency and duration of function calls. Most commonly, profiling information serves to aid program optimization.

How can you profile your golang REST API server in a super simple way :

First : add some lines to your server code

import _ "net/http/pprof"

And then add a listener (I normally use a command line flag to trigger this) :

go func() {
http.ListenAndServe("localhost:6000", nil)
}()

Start your server and generate some load. While your code is running under the load you generated extract the profiler data :

go tool pprof http://localhost:6000/debug/pprof/profile
Fetching profile over HTTP from http://localhost:6000/debug/pprof/profile
Saved profile in /home/paul/pprof/pprof.wm-server.samples.cpu.008.pb.gz
File: wm-server
Build ID: c806572b51954da99ceb779f6d7eee3600eae0fb
Type: cpu
Time: Dec 19, 2018 at 1:41pm (CET)
Duration: 30.13s, Total samples = 17.35s (57.58%)
Entering interactive mode (type "help" for commands, "o" for options)
(pprof)

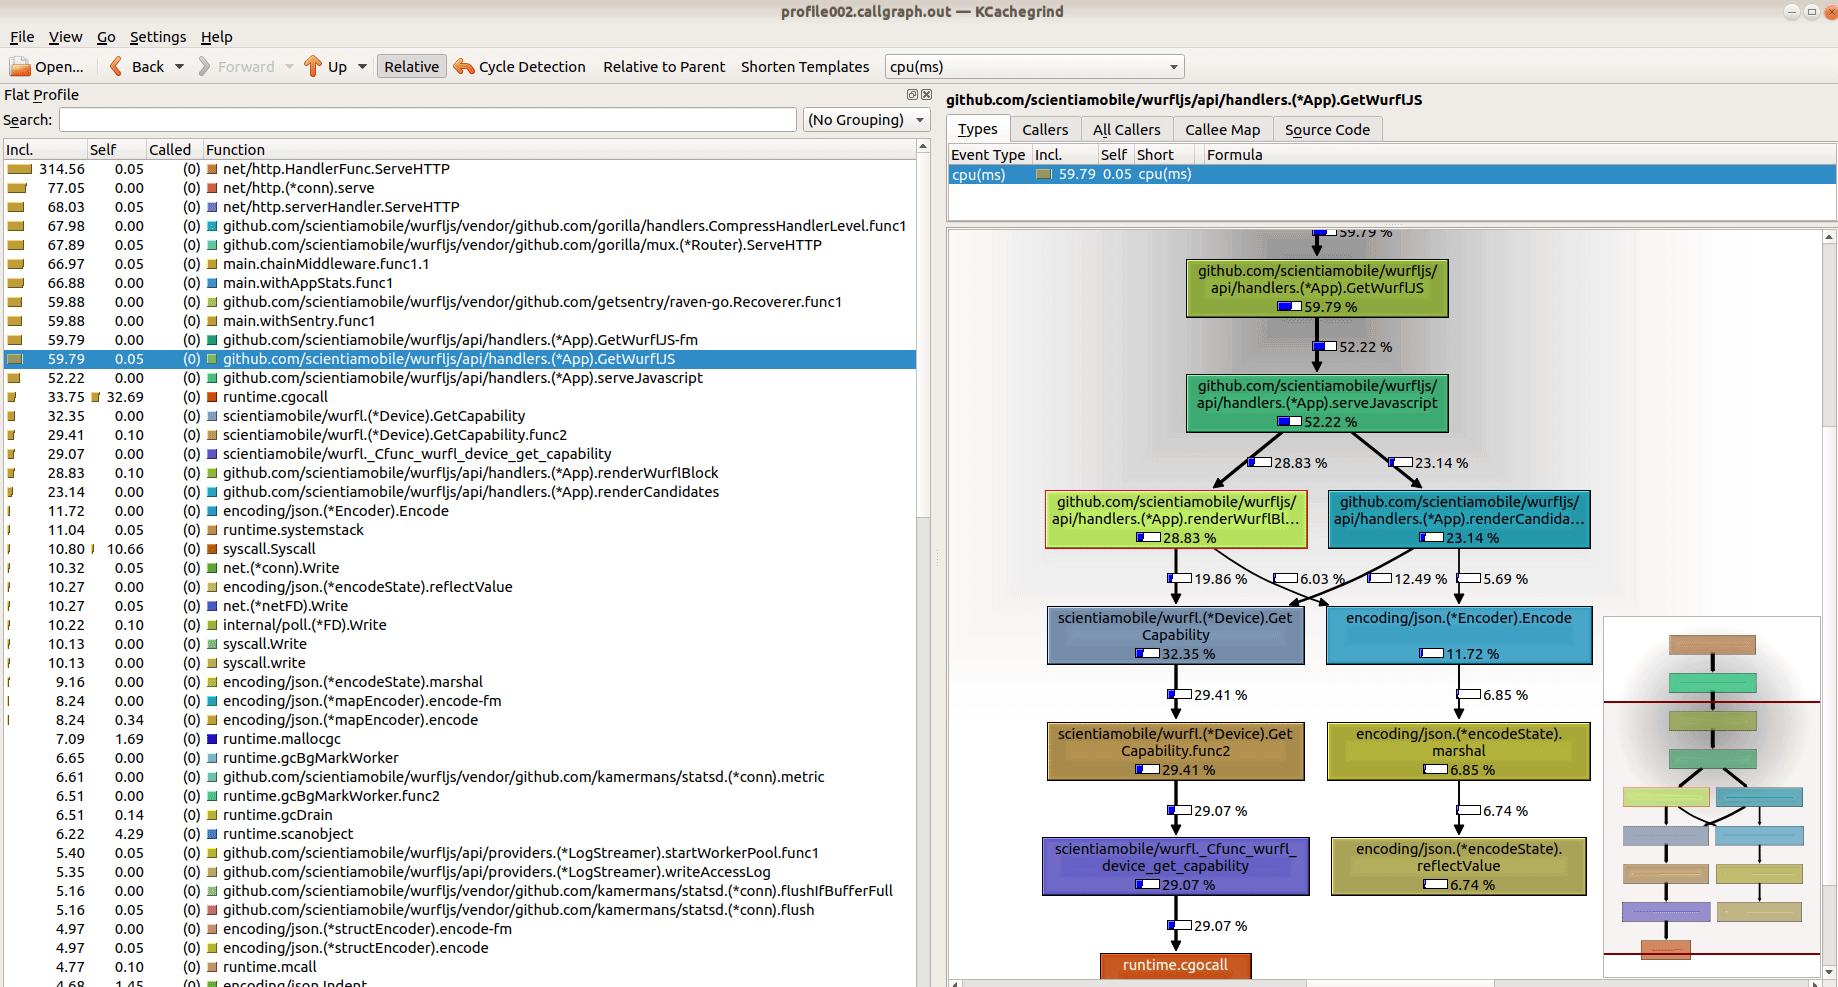
You have many commands at this point but what I prefer to do, having used kcachegrind for years, is to fire it up using the kcachegrind command :

(pprof) kcachegrind

This will generate a callgrind formatted file and run kcachegrind on it to let you do all the usual analysis that you’re probably already used to do (call graph, callers, callees ..)

glibc 2.25 bug : strstr() runs 10 times slower than on 2.24

Linux is used on 54.9% of the world websites : almost every application running on a linux machine uses the glibc which provides the core libraries to access almost every feature of a linux system. The Mighty Glibc started back in 1988 and is a wonderful and glorious project.
As far as the string functions are concerned the sse / avx optimized versions of these functions (strlen, strcpy, strstr, strcmp and more) are up to 10 times faster than their corresponding standard c implementations (which for example you might find in the libmusl) when run on a sse/avx capable cpu.

We rely a lot on glibc string functions and that’s why we found that glibc 2.25 introduced some optimization on the AVX capable processors and this disabled sse* optimizations for methods that don’t have a avx2 optimized implementation (strstr, strcat, and I’m afraid parts of the math functions). For further details go here.
The bug affects ubuntu 18, debian 10, fedora 26 to 28.
A fix will come for sure, hopefully in glibc 2.29.

Update on November 3, 2020 : This bug was fixed in the package glibc – 2.27-3ubuntu1.3

Measuring memory footprint of a linux/macosx application


If you’re selling an API or an application which is deployed on production systems, one of the questions your customers might ask you is what is the memory footprint of your API/application in order for them to account for an increase of memory requirements due to using your product. After some research I think that the best tool for measuring and debugging any increases/decrease of your mem footprint is valgrind –tool=massif together with ms_print reporting tools.

Massif is a Heap memory profiler and will measure how much/when you allocate heap memory in your code and show the involved code. Run :

valgrind --tool=massif

this will execute the code and generate a massif.out.<pid> file that you may visualize with

ms_print massif.out.<pid>

Take a ride, the output is absolutely useful and you will have an histogram of how much memory is used at every sampling moment.